| skim_type | skim_variable | n_missing | complete_rate | character.min | character.max | character.empty | character.n_unique | character.whitespace | factor.ordered | factor.n_unique | factor.top_counts | numeric.mean | numeric.sd | numeric.p0 | numeric.p25 | numeric.p50 | numeric.p75 | numeric.p100 | numeric.hist |
|---|---|---|---|---|---|---|---|---|---|---|---|---|---|---|---|---|---|---|---|
| character | SR_health | 0 | 1 | 4 | 7 | 0 | 4 | 0 | NA | NA | NA | NA | NA | NA | NA | NA | NA | NA | NA |
| factor | Gender | 0 | 1 | NA | NA | NA | NA | NA | FALSE | 3 | M: 4, F: 3, O: 2 | NA | NA | NA | NA | NA | NA | NA | NA |
| numeric | Height | 0 | 1 | NA | NA | NA | NA | NA | NA | NA | NA | 165.66667 | 15.97655 | 133 | 156 | 166 | 178 | 183 | ▂▁▃▃▇ |
| numeric | Weight | 0 | 1 | NA | NA | NA | NA | NA | NA | NA | NA | 70.11111 | 21.24526 | 45 | 55 | 70 | 80 | 110 | ▇▂▃▂▂ |
| numeric | HC_time | 0 | 1 | NA | NA | NA | NA | NA | NA | NA | NA | 33.33333 | 19.68502 | 10 | 20 | 25 | 50 | 65 | ▇▂▂▂▃ |
Manuscript/Report Template for a Data Analysis Project
Arlyn Santiago contributed to this exercise
This is a class exercise using fabricated data
1 Summary/Abstract
The time required to travel to healthcare facilities can affect how often people receive. Longer travel times may mean patients see the doctor less often and may lead to adverse health outcomes, such as higher BMI. It may also change an individual’s perception of their own health status (Kelly, Hulme, Farragher, & Clarke, 2016).
2 Introduction
2.1 General Background Information
Fourteen people were included in this study. Their height, weight, and gender were recorded during their interview. The participants were asked how long (in minutes) it takes takes to travel to the nearest healthcare facility from their home. The participants were also asked to rate their health from using poor, fair, good, excellent.
2.2 Description of data and data source
Fourteen people were included in this study. Their height, weight, and gender were recorded during their interview. The participants were asked how long (in minutes) it takes takes to travel to the nearest healthcare facility from their home. The participants were also asked to rate their health from using poor, fair, good, excellent.
2.3 Questions/Hypotheses to be addressed
Does travel time to access healthcare affect health outcomes, such as weight, and alter a person’s perception of their own health status?
An example of a similar study can he found in (Kelly et al., 2016).
3 Methods
3.1 Data aquisition
Data was collected during in-person interviews with 14 people. Interview responses were entered into an Excel spreadsheet by multiple study employees.
3.2 Data import and cleaning
Data was cleaned using R code. Records that fell outside of defined parameters were removed. Of the 14 orginal records, 9 remained after cleaning
3.3 Statistical analysis
Simple scatter and box plots were used to plots visualize the data. Descriptive tables were created. Finally, linear models were generated in R using the ggplot2 package.
4 Results
4.1 Exploratory/Descriptive analysis
View the tables and figures below for a better understanding of the data.
Table 1 shows a summary of the data.
4.2 Basic statistical analysis
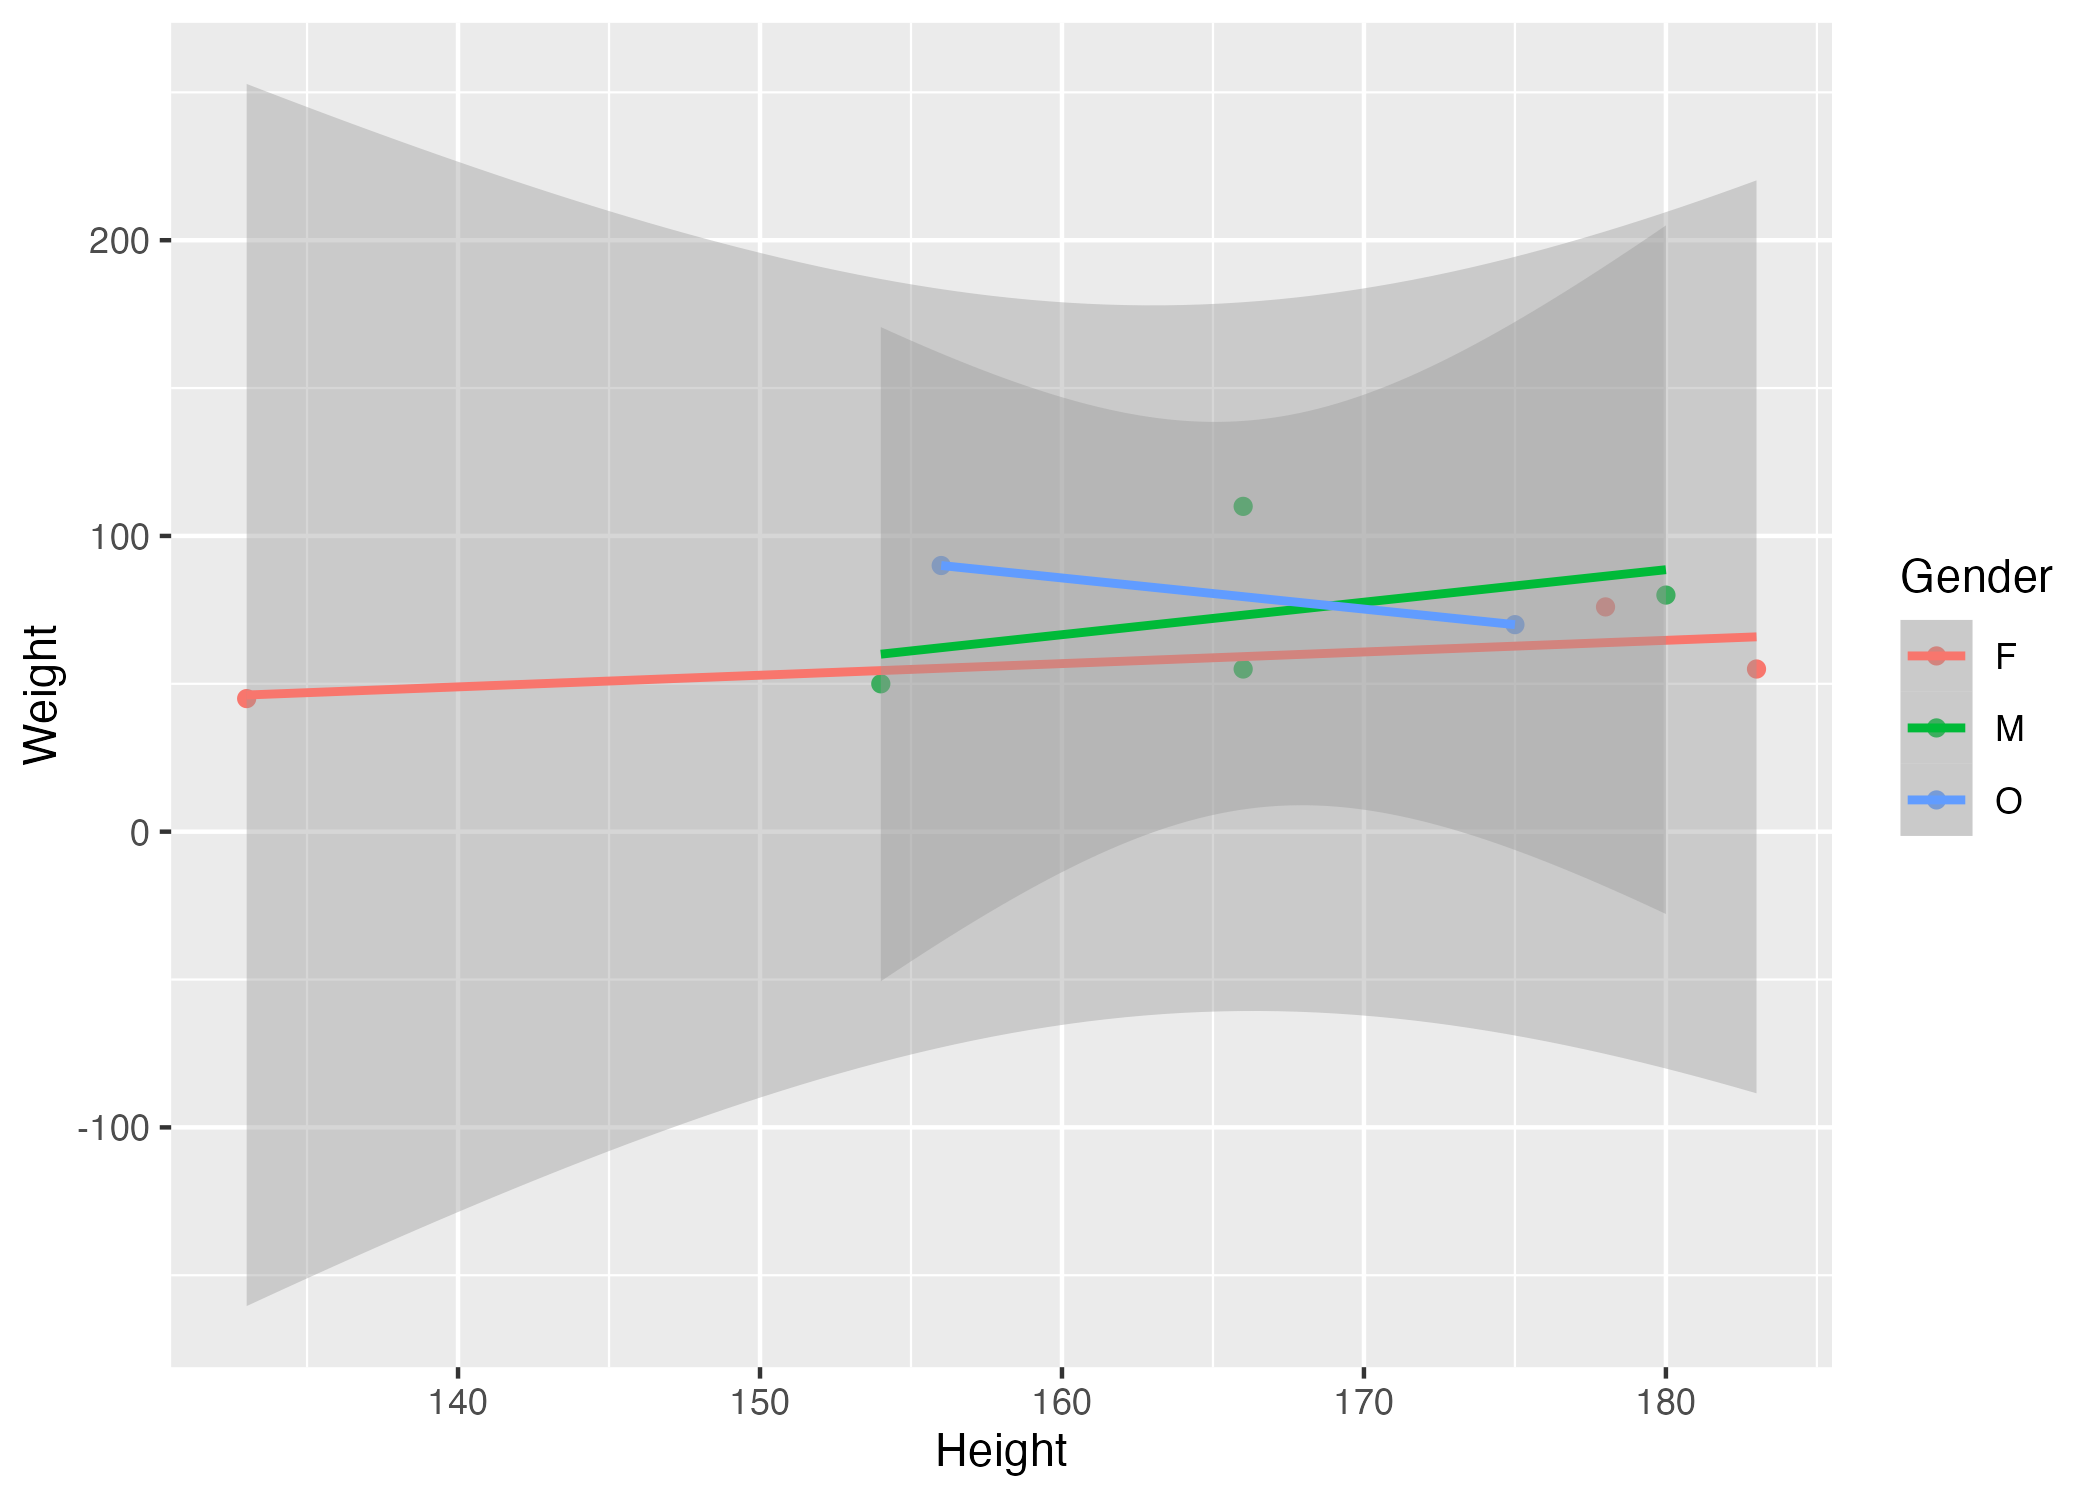
Figure 1 shows a scatterplot figure produced by one of the R scripts.
4.3 Full analysis
Example Table 2 shows a summary of a linear model fit.
| term | estimate | std.error | statistic | p.value |
|---|---|---|---|---|
| (Intercept) | 149.2726967 | 23.3823360 | 6.3839942 | 0.0013962 |
| Weight | 0.2623972 | 0.3512436 | 0.7470519 | 0.4886517 |
| GenderM | -2.1244913 | 15.5488953 | -0.1366329 | 0.8966520 |
| GenderO | -4.7644739 | 19.0114155 | -0.2506112 | 0.8120871 |
5 Discussion
5.1 Summary and Interpretation
In this study, there were no statistically significant relationships between travel time to the nearest healthcare facility and
5.2 Strengths and Limitations
Given the small sample size, the results are not generalizable to any population. A larger sample size would be needed for more reliable results. Weight is not a proxy for health and it is the only health outcome included in this study.
5.3 Conclusions
Travel time to access healthcare has been demonstrated in other studies as a factor that can lead to adverse health outcomes. Larger sample sizes and better data collection and input methods could help to illustrate the relationship.
6 Appendix 1
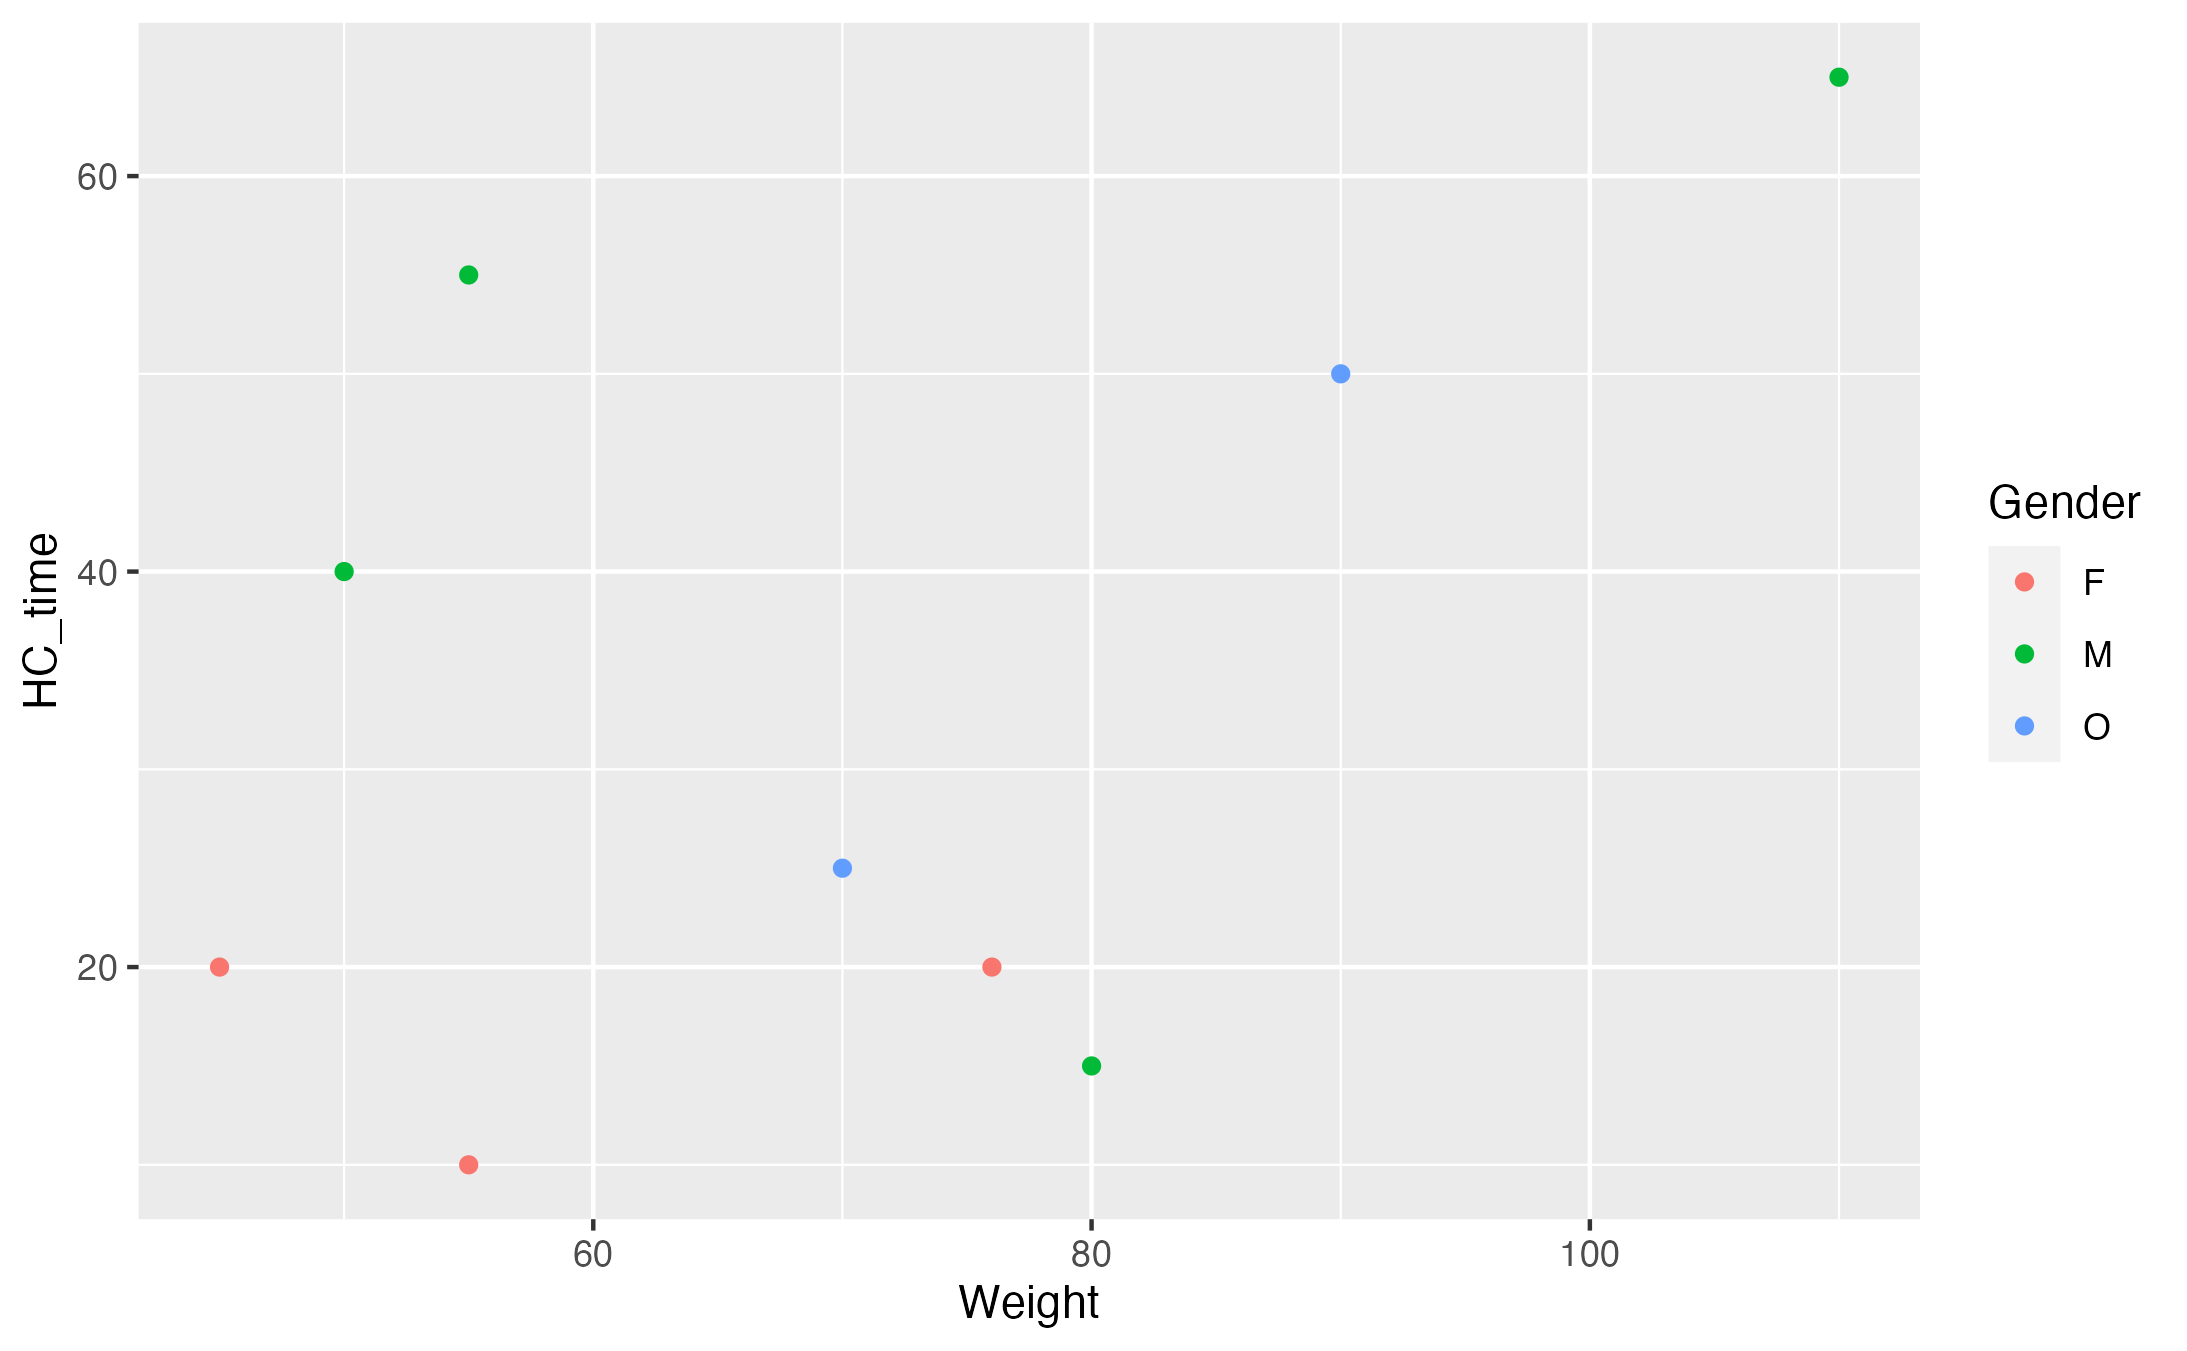
6.1 Scatter plot 1
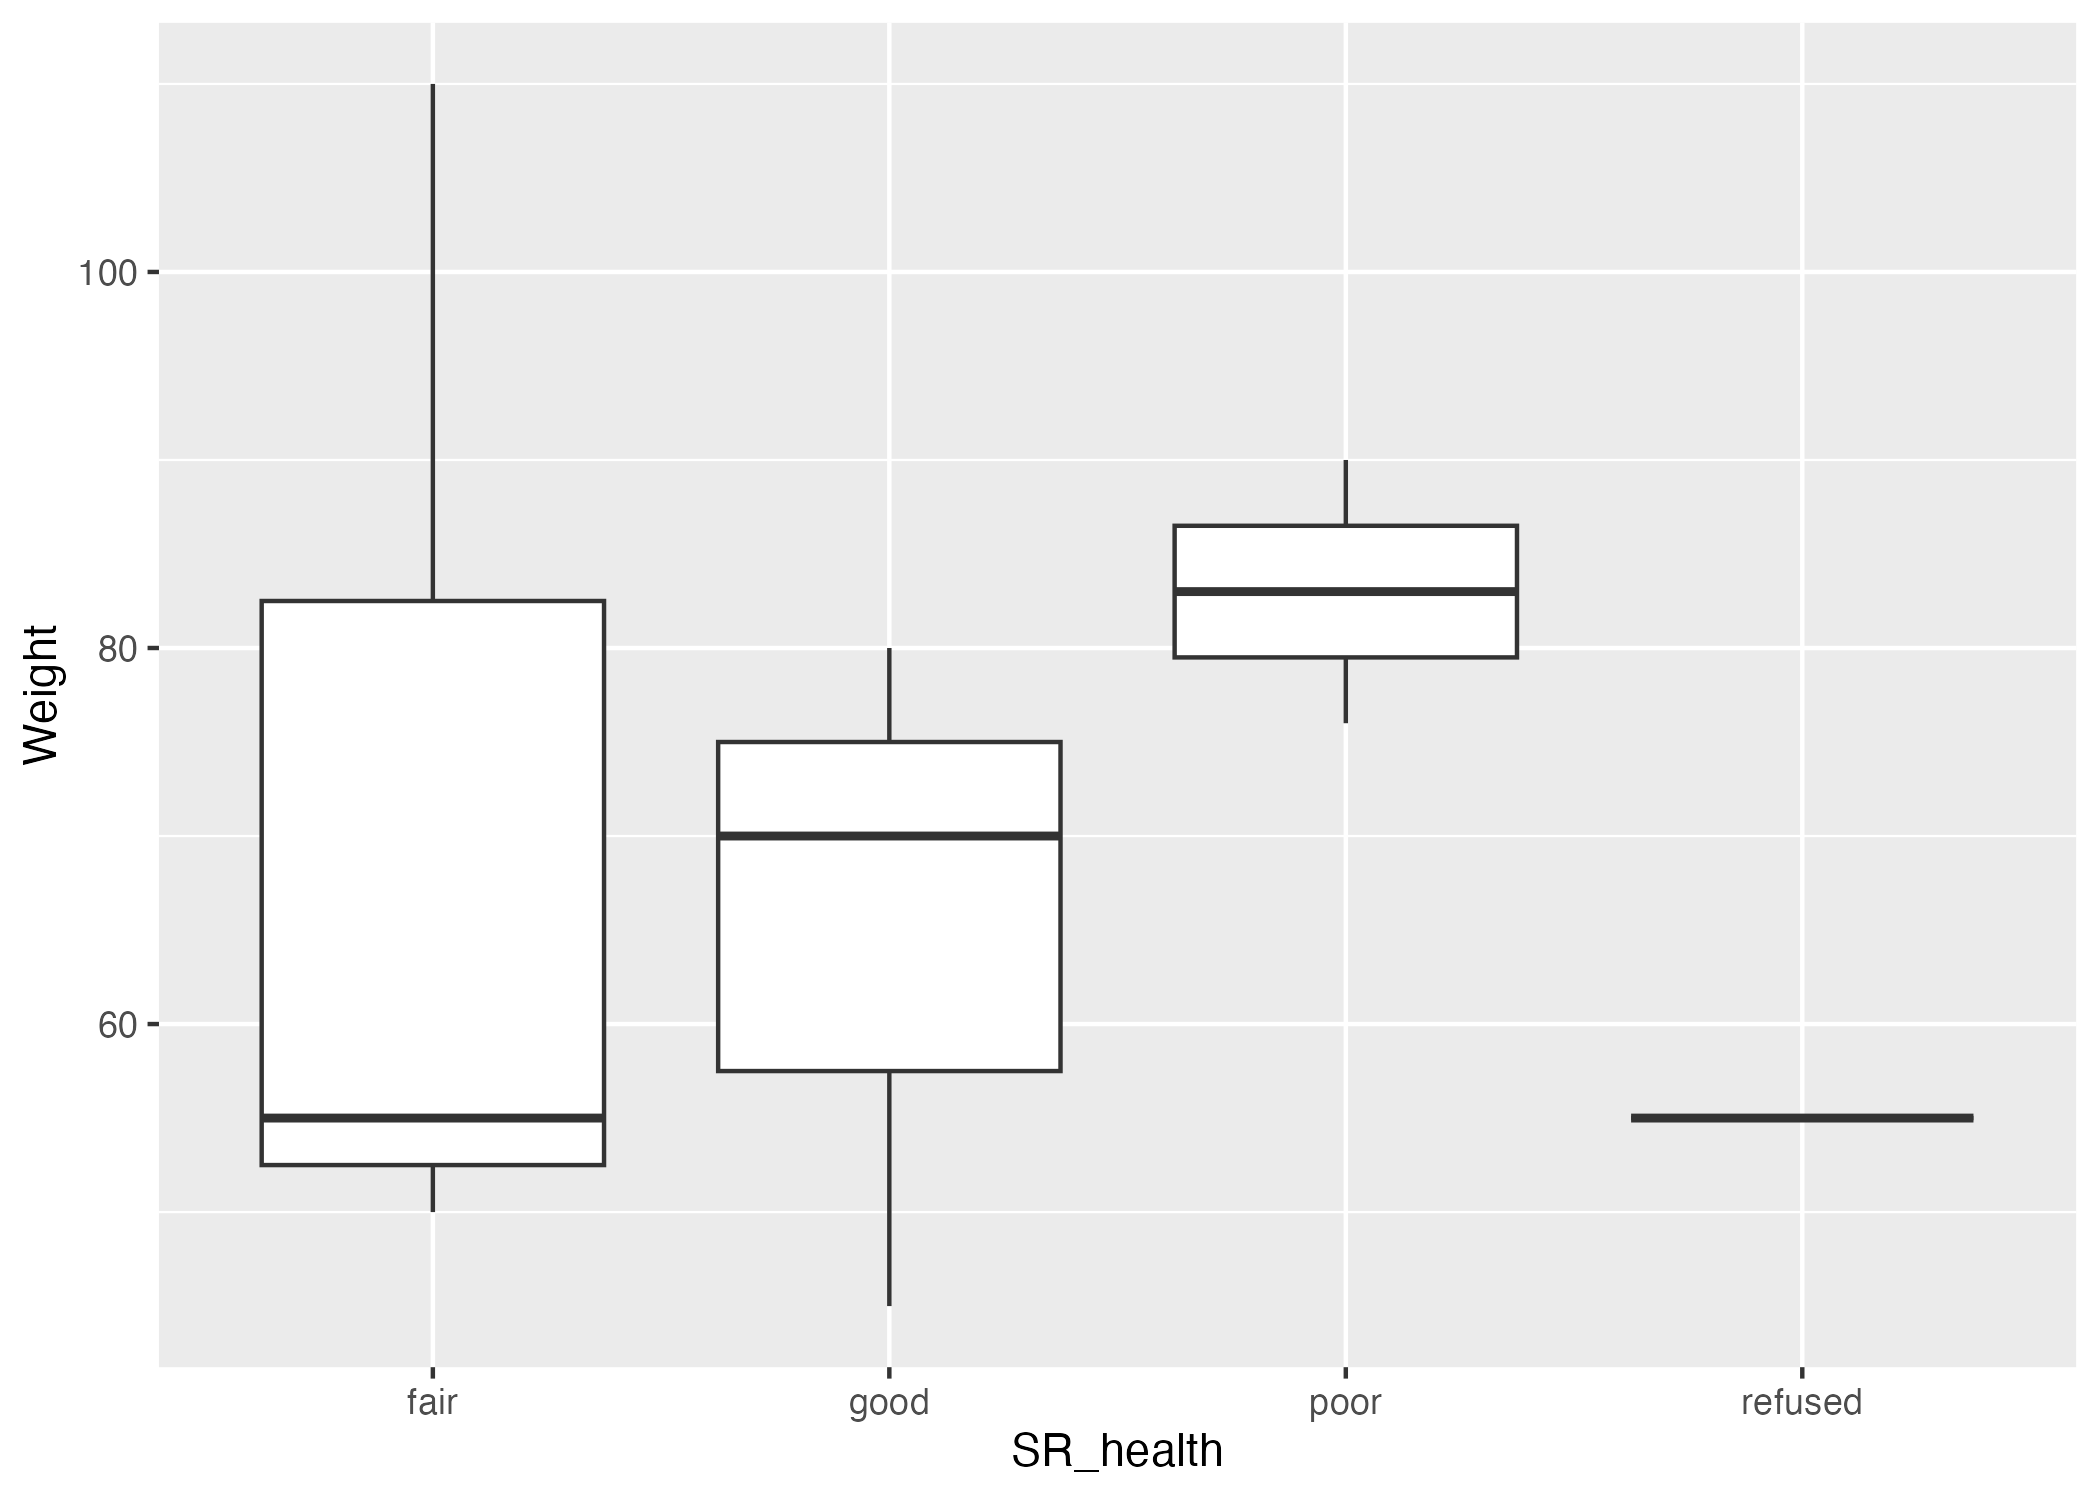
6.2 Box plot 1
| term | estimate | std.error | statistic | p.value |
|---|---|---|---|---|
| (Intercept) | 174.7346939 | 39.3640594 | 4.4389399 | 0.0113433 |
| SR_healthgood | -7.2925170 | 28.6897378 | -0.2541856 | 0.8118841 |
| SR_healthpoor | 0.6224490 | 22.4824685 | 0.0276860 | 0.9792388 |
| SR_healthrefused | 10.6530612 | 38.4051156 | 0.2773865 | 0.7952290 |
| HC_time | -0.2387755 | 0.7051065 | -0.3386375 | 0.7519124 |
In this linear model, none of the relationships are statistically significant at alpha = 0.05.
7 References
Kelly, C., Hulme, C., Farragher, T., & Clarke, G. (2016). Are differences in travel time or distance to healthcare for adults in global north countries associated with an impact on health outcomes? A systematic review. BMJ Open, 6(11), e013059. https://doi.org/10.1136/bmjopen-2016-013059